SEO Portfolio : Real Google Search Console Results

Home / Portfolio
Real Search Console results

Real Google Search Console charts from projects our team has worked on, with clicks, impressions and average position. Names are hidden to protect clients.
Month-to-month, no contracts90-day progress guaranteeWhite-hat only
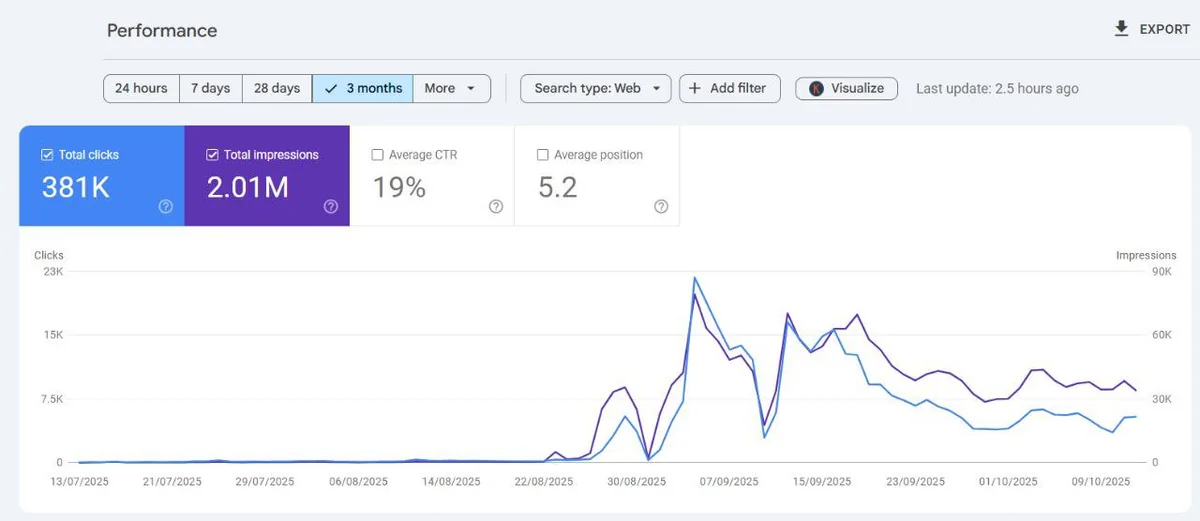
Google Search Console performance chart for a client website showing 381K clicks and 2.01M impressions over 3 months

Quick answer

Our portfolio shows real Google Search Console data: unedited charts with total clicks, impressions and average position from different websites, with names withheld.

Gallery

Google Search Console Results

Each image shows the date range selected in Search Console and the totals at that time. Results vary by site and are not a promise for yours.
Google Search Console performance chart for a client website showing 381K clicks and 2.01M impressions over 3 months
381K clicks · 2.01M impressions · avg. position 5.2 · 3 months
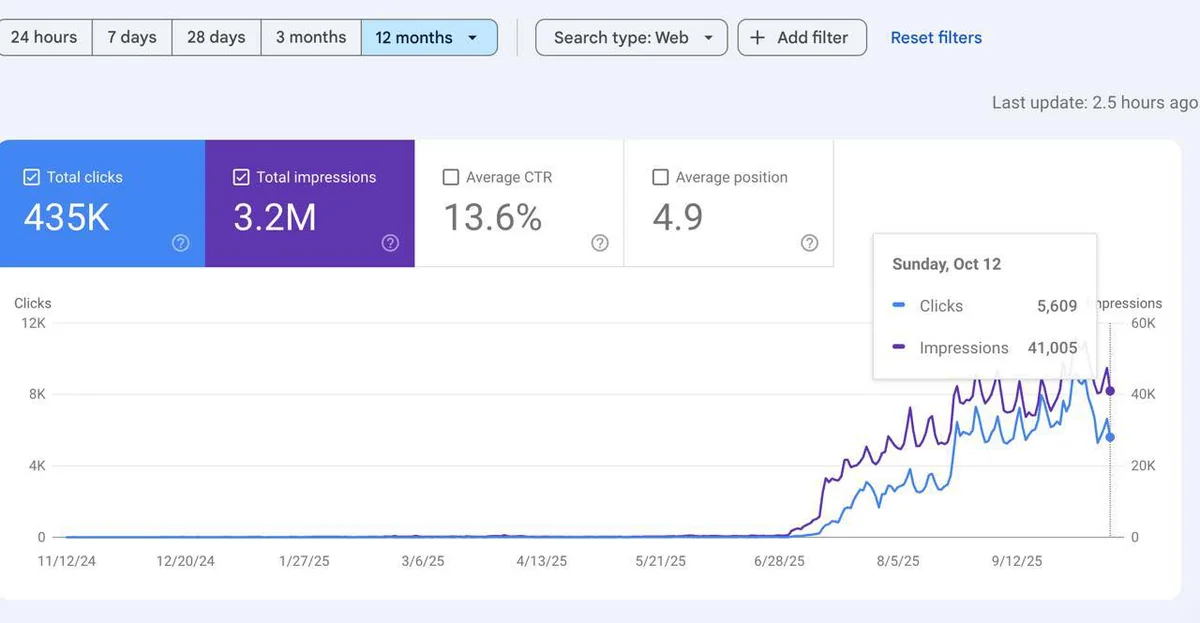
Google Search Console performance chart for a client website showing 435K clicks and 3.2M impressions over 12 months
435K clicks · 3.2M impressions · avg. position 4.9 · 12 months
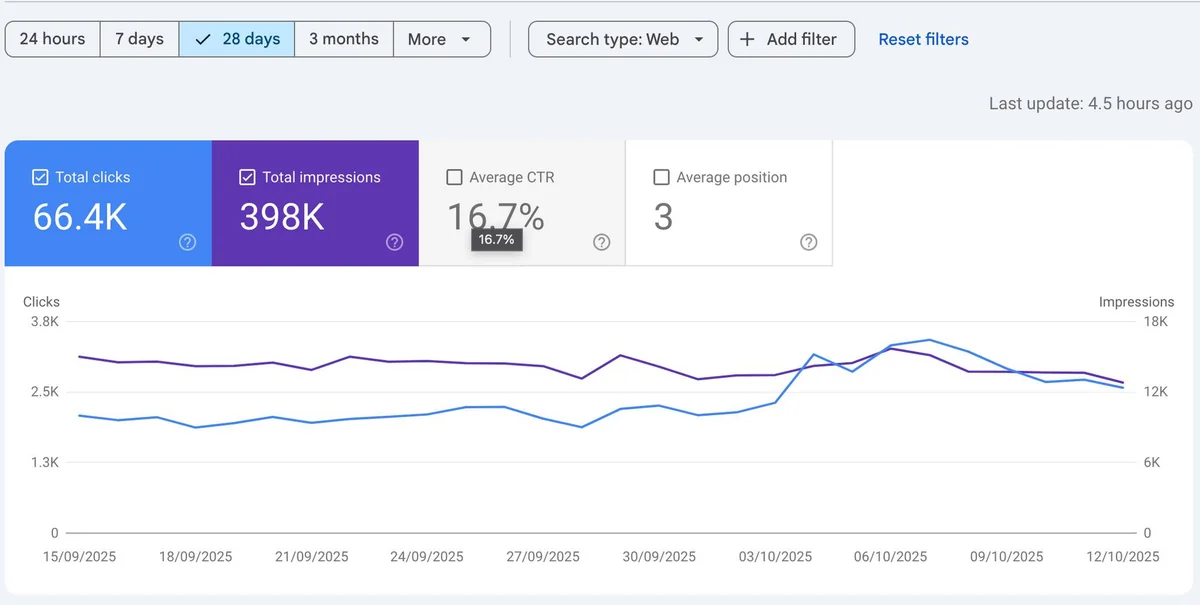
Google Search Console performance chart for a client website showing 66.4K clicks and 398K impressions over 28 days
66.4K clicks · 398K impressions · avg. position 3.0 · 28 days
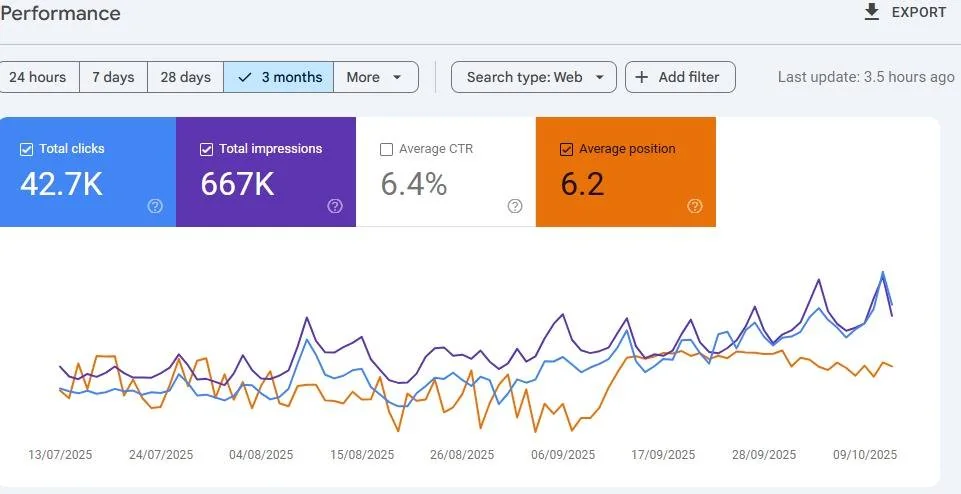
Google Search Console performance chart for a client website showing 42.7K clicks and 667K impressions over 3 months
42.7K clicks · 667K impressions · avg. position 6.2 · 3 months
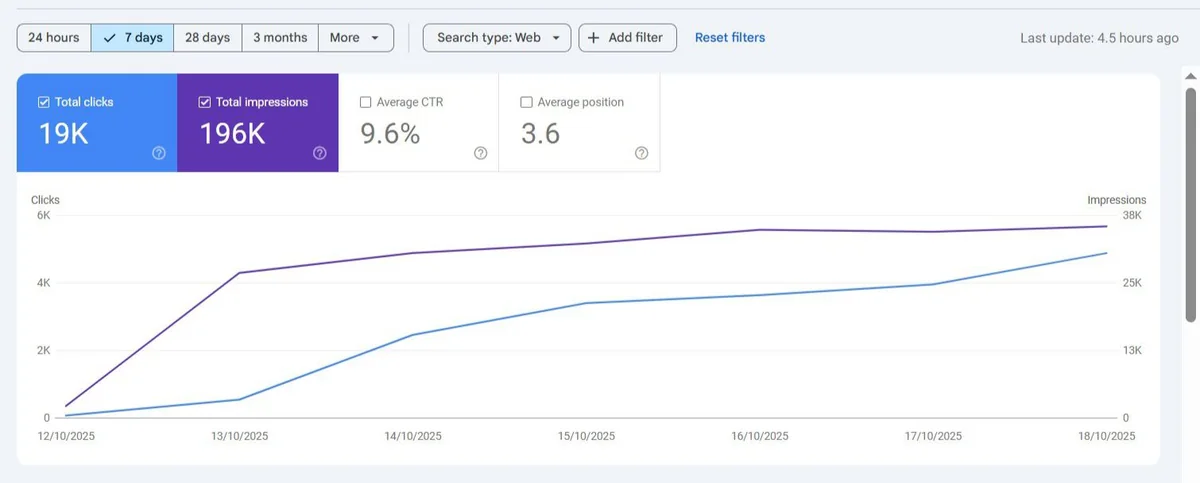
Google Search Console performance chart for a client website showing 19K clicks and 196K impressions over 7 days
19K clicks · 196K impressions · avg. position 3.6 · 7 days
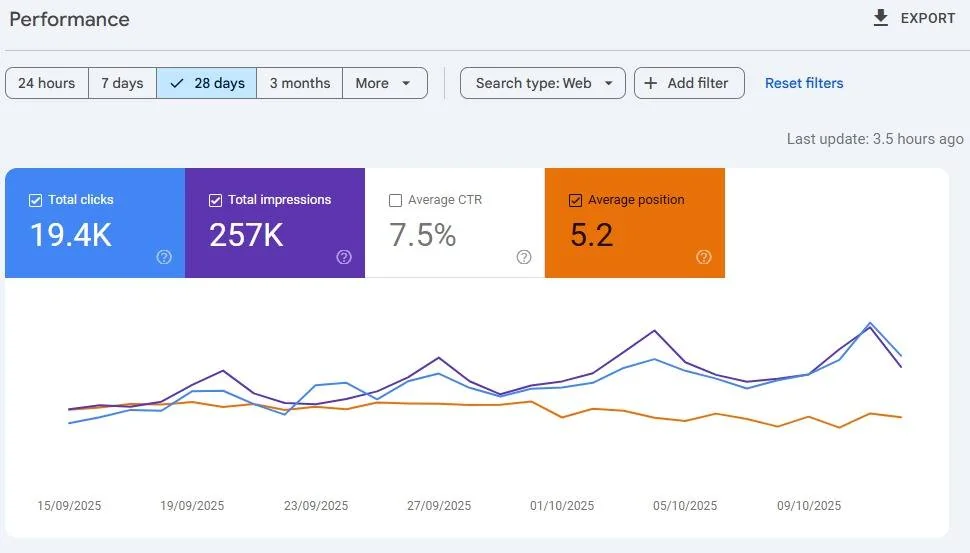
Google Search Console performance chart for a client website showing 19.4K clicks and 257K impressions over 28 days
19.4K clicks · 257K impressions · avg. position 5.2 · 28 days
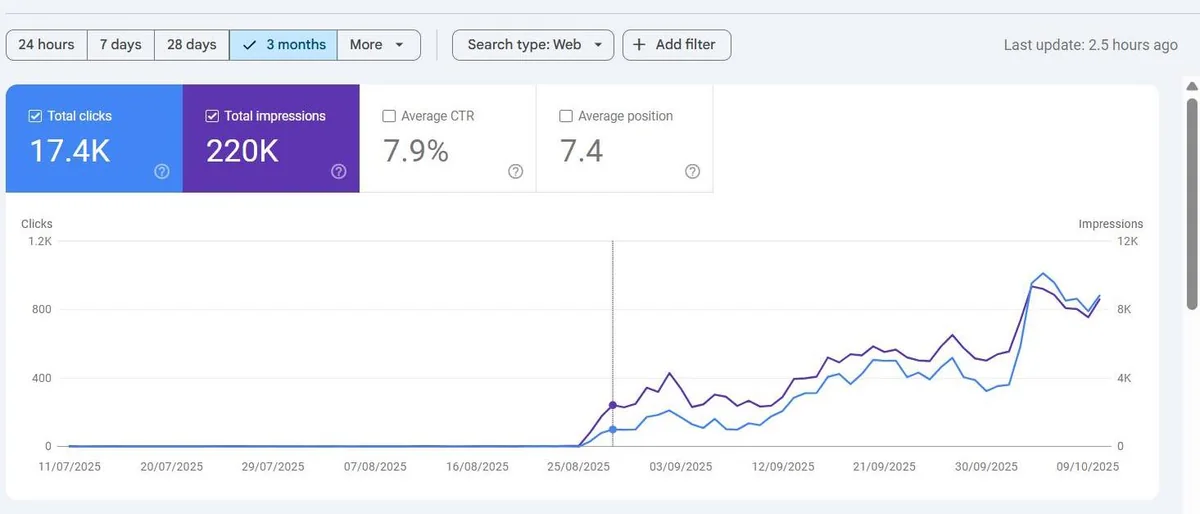
Google Search Console performance chart for a client website showing 17.4K clicks and 220K impressions over 3 months
17.4K clicks · 220K impressions · avg. position 7.4 · 3 months
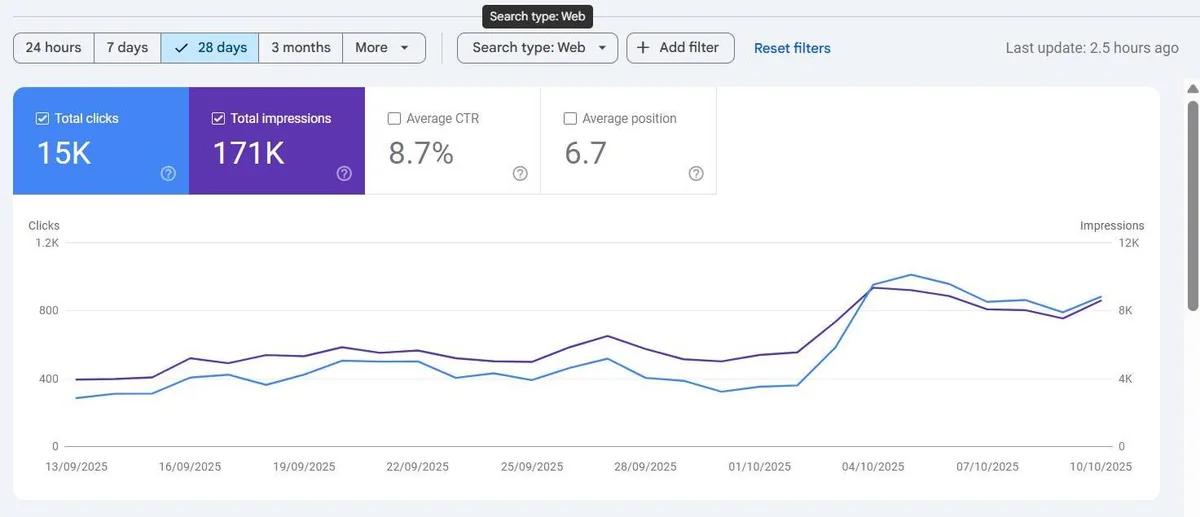
Google Search Console performance chart for a client website showing 15K clicks and 171K impressions over 28 days
15K clicks · 171K impressions · avg. position 6.7 · 28 days
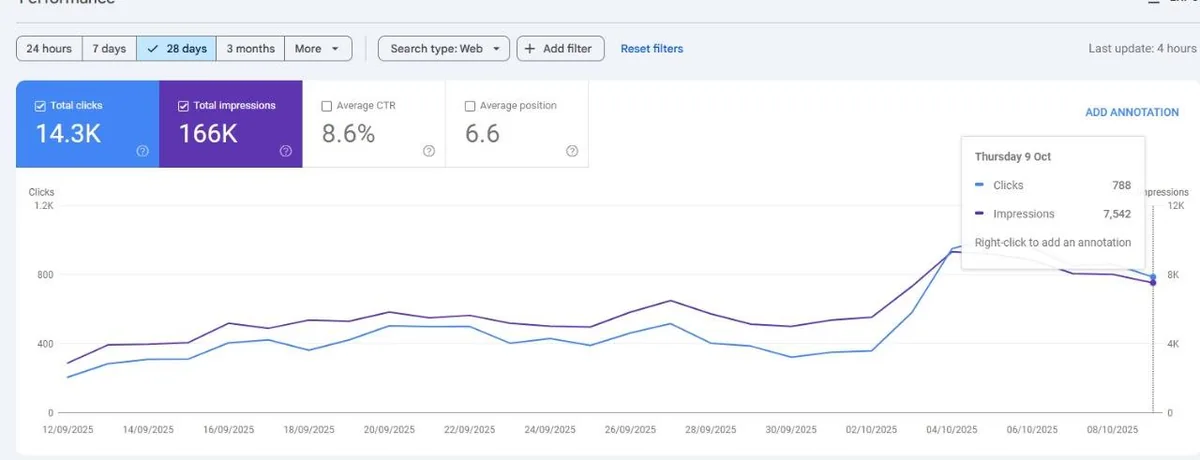
Google Search Console performance chart for a client website showing 14.3K clicks and 166K impressions over 28 days
14.3K clicks · 166K impressions · avg. position 6.6 · 28 days
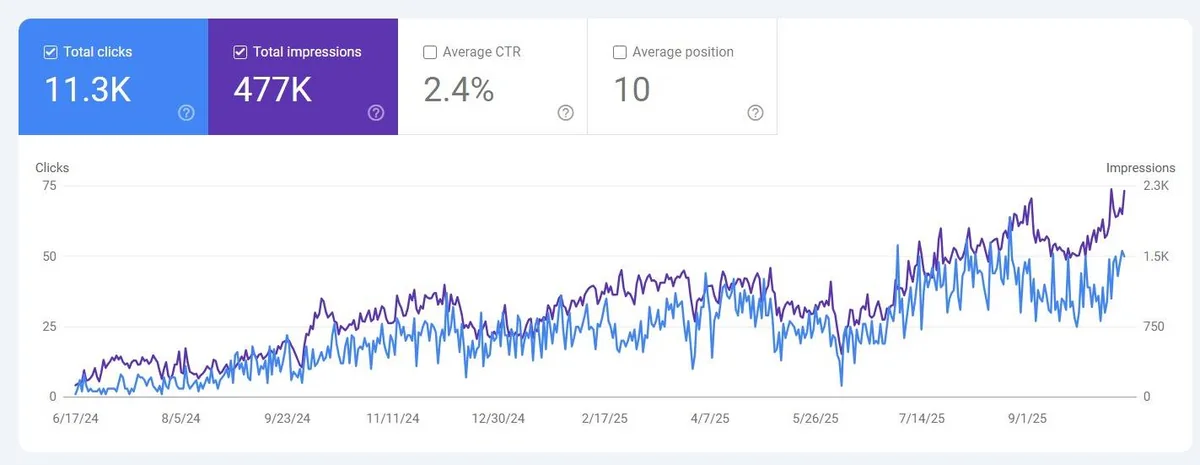
Google Search Console performance chart for a client website showing 11.3K clicks and 477K impressions over a long period
11.3K clicks · 477K impressions · avg. position 10 · long-term view
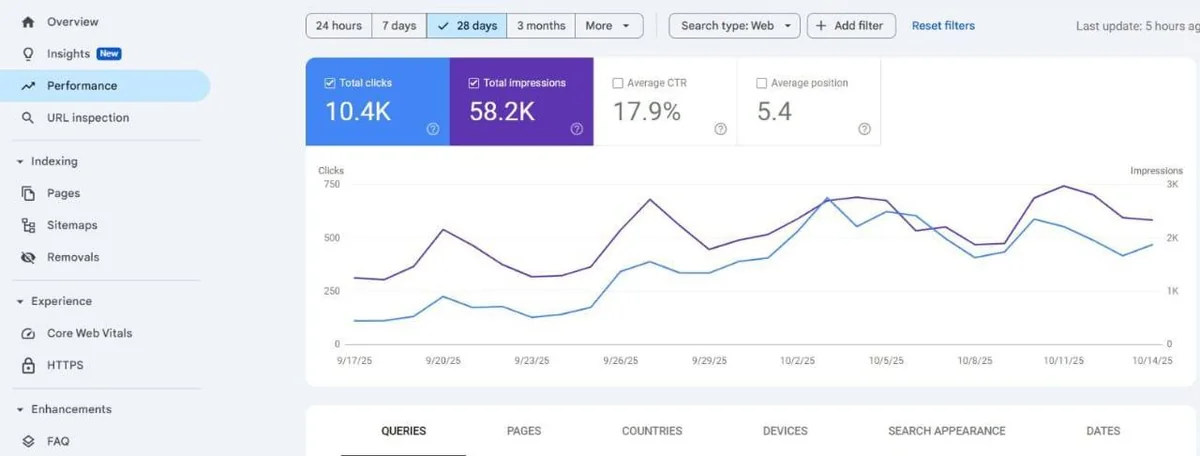
Google Search Console performance chart for a client website showing 10.4K clicks and 58.2K impressions over 28 days
10.4K clicks · 58.2K impressions · avg. position 5.4 · 28 days
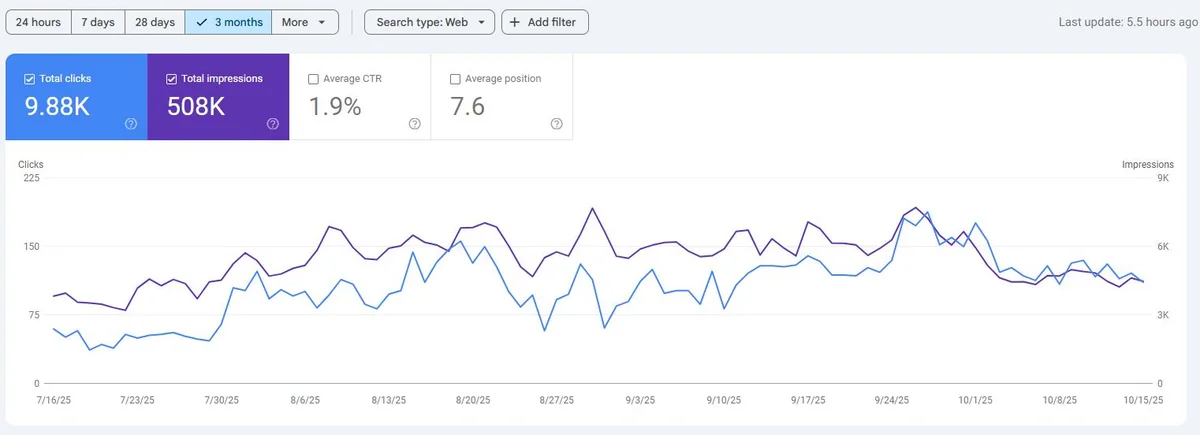
Google Search Console performance chart for a client website showing 9.88K clicks and 508K impressions over 3 months
9.88K clicks · 508K impressions · avg. position 7.6 · 3 months
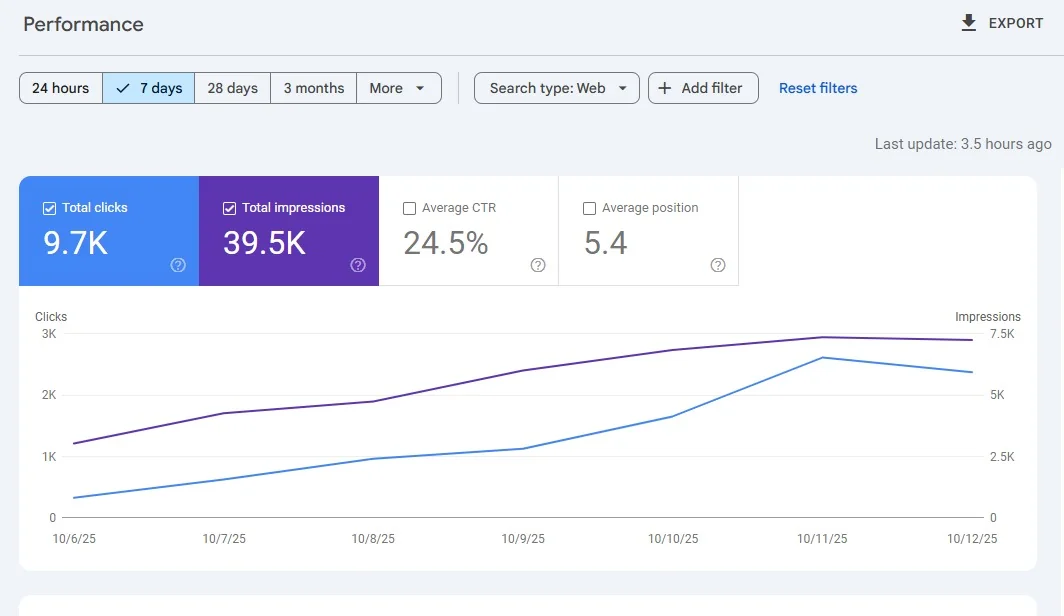
Google Search Console performance chart for a client website showing 9.7K clicks and 39.5K impressions over 7 days
9.7K clicks · 39.5K impressions · avg. position 5.4 · 7 days
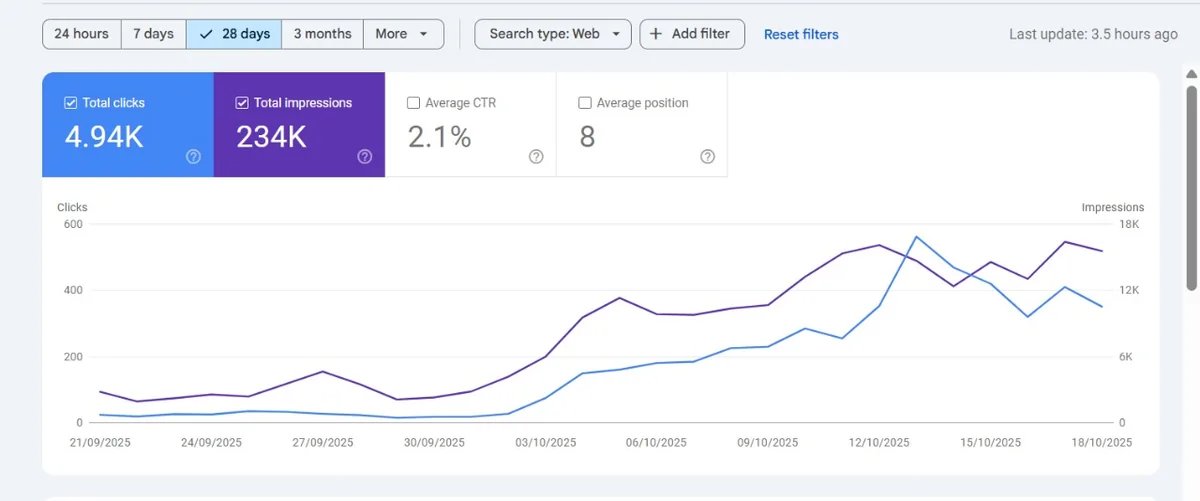
Google Search Console performance chart for a client website showing 4.94K clicks and 234K impressions over 28 days
4.94K clicks · 234K impressions · avg. position 8 · 28 days
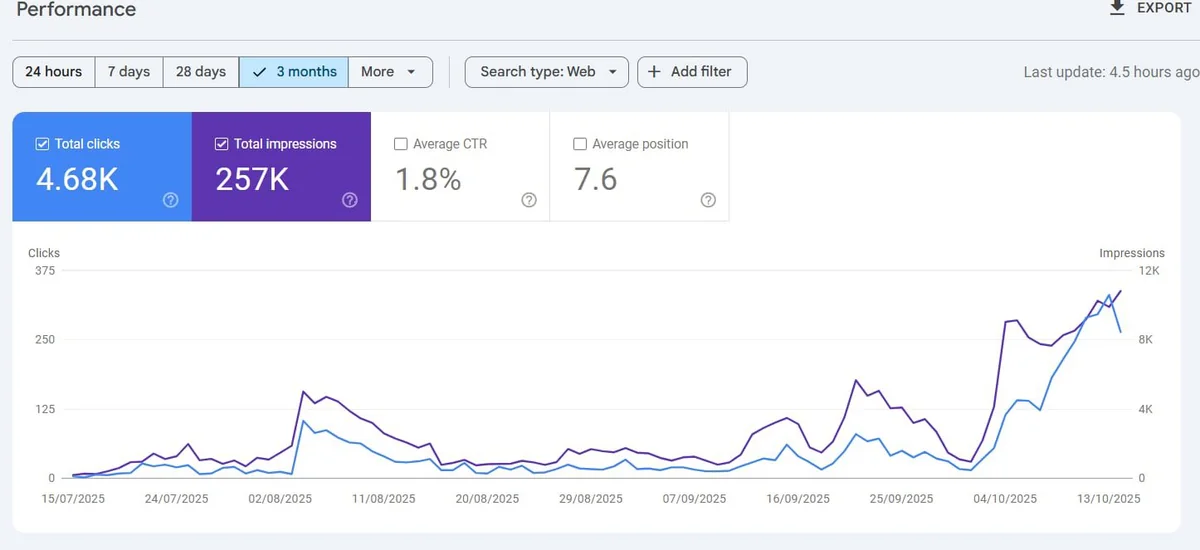
Google Search Console performance chart for a client website showing 4.68K clicks and 257K impressions over 3 months
4.68K clicks · 257K impressions · avg. position 7.6 · 3 months
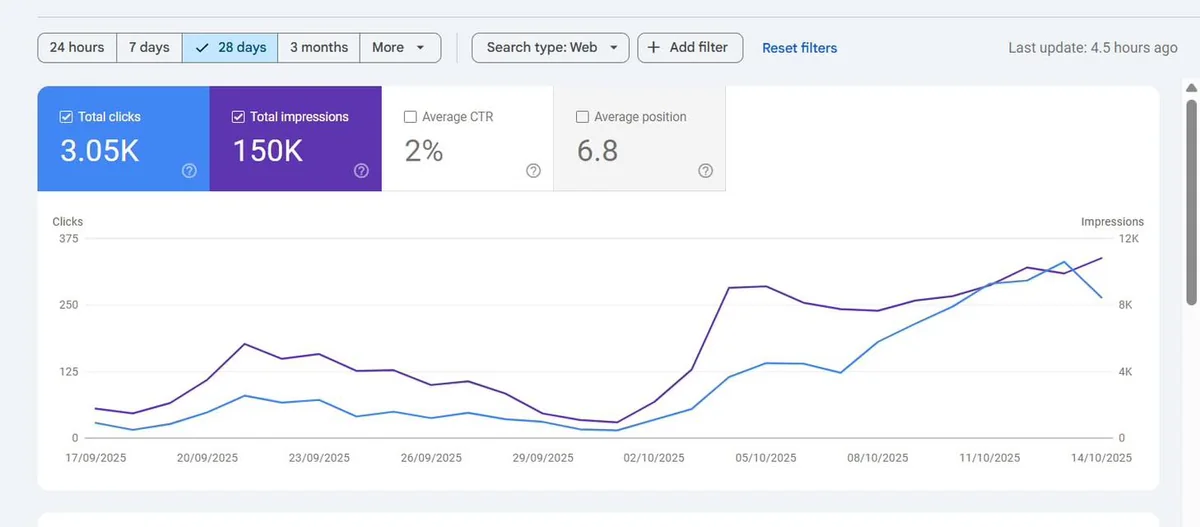
Google Search Console performance chart for a client website showing 3.05K clicks and 150K impressions over 28 days
3.05K clicks · 150K impressions · avg. position 6.8 · 28 days
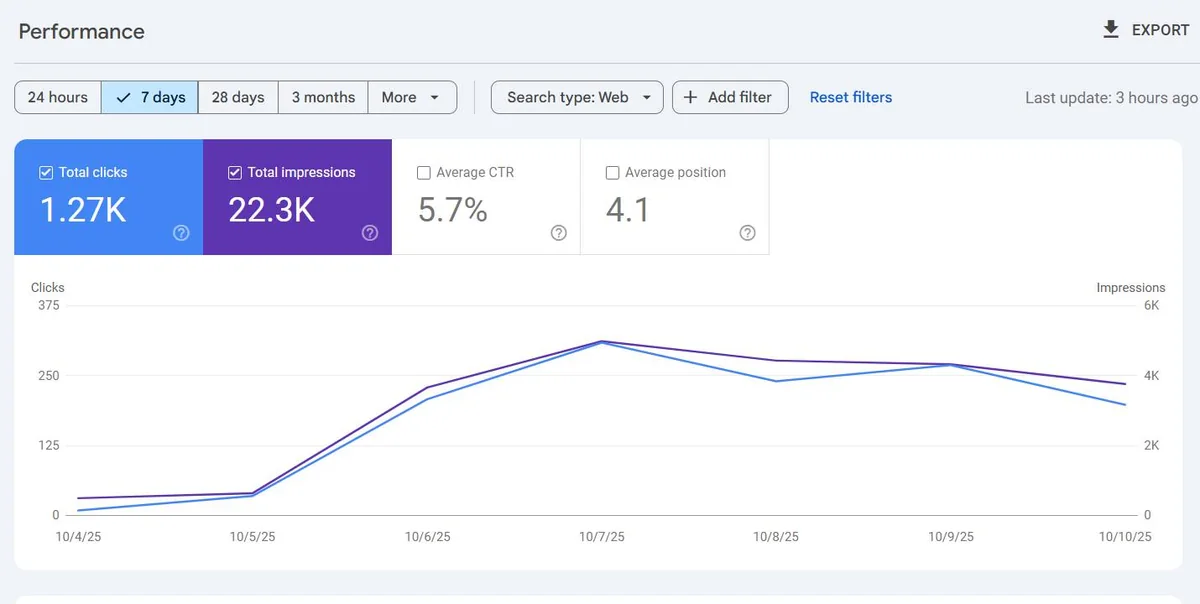
Google Search Console performance chart for a client website showing 1.27K clicks and 22.3K impressions over 7 days
1.27K clicks · 22.3K impressions · avg. position 4.1 · 7 days
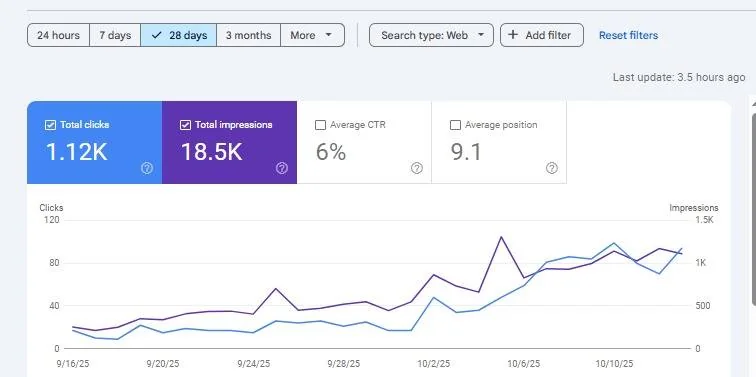
Google Search Console performance chart for a client website showing 1.12K clicks and 18.5K impressions over 28 days
1.12K clicks · 18.5K impressions · avg. position 9.1 · 28 days

How to read these

What the Numbers Mean

  • Clicks: visits from Google results to the website
  • Impressions: times the site appeared in results
  • Average position: typical rank in results, where a lower number is better
  • Date range: the period chosen in Search Console, shown with each image

Want the technical side too? See our case studies with before and after speed scores.

FAQ

Portfolio Questions, Answered Straight

Are these screenshots real?

Yes. They are unedited Google Search Console performance screenshots from websites our team has worked on. Domains, queries and brand names are hidden or not shown.

Which businesses are in the portfolio?

The sites cover different industries and countries, and we withhold names for privacy. If you want to talk through a project close to your business, ask during your free audit.

What do clicks, impressions and position mean?

Impressions count how often a page appears in Google results. Clicks count visits from those results. Average position is where the page ranks on average, so lower is better.

Will my site get the same results?

We cannot promise that. Results depend on your competition, site and effort, and we never guarantee a #1 ranking. A free audit shows what a realistic plan looks like.

Why do some charts show dips?

Search traffic moves up and down with seasons, updates and demand. We show real charts rather than only the best days.

Free, no obligation

Want Charts Like These for Your Business?

Request a free audit and we will tell you honestly what a realistic plan looks like for your site.

Dallas SEO Agency4320 Main St, Dallas, TX 75226, USA
Mon–Fri 9:00 AM–6:00 PM CST
Contact us
Chat on WhatsApp